Crypto Breadth Indicator for Perp Traders: Why One Strong Coin Is Not Enough
A guide to crypto breadth indicators for perp traders. What breadth measures, why one strong coin in a thin tape is a trap, and how breadth gates the conviction of any single-name setup.
Summary
Breadth is the proportion of the perp universe moving with the trend at the same time. A single coin up 8 percent in a tape where 80 percent of perps are green is a different setup from the same coin up 8 percent in a tape where only 22 percent of perps are green. The candle looks identical; the conviction does not.
Most retail traders read a single chart and act as if its move is happening in a vacuum. A breadth indicator turns that into a two-layer read: the single-name candle is the foreground, the breadth label is the background, and the combination is what decides whether the move has tape support or is a lonely spike that will mean-revert when the broader bid does not arrive.
What "breadth" means on a perp exchange
Breadth on a perpetual-futures venue is the count of contracts moving in the same direction over a defined window, expressed as a percentage of the eligible universe. A simple definition: across the hundreds of active USDT-perp contracts on Bybit, how many are positive over the trailing 24 hours, and how many are negative. The ratio is the breadth read. Different cuts of the window — six hours, four hours, one hour — produce different breadth labels, all answering the same shape of question.
The math is unglamorous, but the read is powerful because it captures something a single-name chart cannot show. A trader watching a $SOL chart can see SOL up 4 percent without knowing whether 75 percent or 25 percent of the rest of the perp universe is also up. That fact is the regime context for the chart in front of them, and it is the difference between a setup that has tape support and a setup that is fading the dominant flow.
On a spot venue the same indicator is sometimes called the advance/decline line or the percent-above-50dma. On perp venues the dimension that matters is the active contract count because perp universes turn over more often than spot listings, and a market-cap-weighted breadth read on a fast-moving universe of altcoin perps would underweight exactly the names that drive most of the intraday opportunity.
Why one strong coin in a thin tape is a trap
A single coin spiking 10 percent in a tape where 22 percent of perps are green is usually a lonely move. Lonely moves can extend — meme runners and idiosyncratic narrative pumps both look this way — but they more often mean-revert because the broader bid is not behind the move. The fast money buys the lonely candle, the broader market does not confirm, and the move unwinds within a few hours when the position-seekers who arrived late discover there is no follow-on flow.
The same coin spiking 10 percent in a tape where 78 percent of perps are green is a different setup. The single-name move is now consistent with a broader risk-on tape, and continuation has structural support. New longs entering the named coin are doing so against a backdrop of new longs entering across the universe, which means the marginal new long is not fighting the dominant flow. Mean-reversion is less likely; continuation has fuel.
The trap is that the candle chart cannot tell the trader which of the two regimes they are in. A 10 percent move looks identical on the time-and-price view regardless of whether 22 percent or 78 percent of the universe is moving the same way. The breadth read is the hidden variable that conditions every other read. A scanner that publishes the breadth label inline with the alert is doing the trader a service that a chart alone cannot.
- Lone strength in low breadth: mean-revert bias.
- Aligned strength in high breadth: continuation bias.
- Lone weakness in high breadth: short-cover risk.
- Aligned weakness in low breadth: capitulation read.
The four-state map: strong/weak coin × high/low breadth
Breadth crossed with single-name direction produces a four-quadrant map. Strong coin in high breadth is the confirm state — the single-name move has tape support, and continuation is the higher-probability path. Strong coin in low breadth is the lonely-move state — the single-name move is fighting the broader tape, and the probability of clean follow-through drops sharply.
Weak coin in low breadth is the aligned-weakness state — the single-name move is consistent with broad capitulation, and oversold bounces can still happen but the conviction belongs to the trend. Weak coin in high breadth is the lonely-weakness state — the single-name move is fighting a risk-on tape, and short trades into rising breadth are statistically the worst configuration for a perp trader to press.
The map is not a forecast. It is a probability tilt. Each quadrant has all four outcomes — continuation, fade, chop, reversal — within it. What the map does is shift the conviction weighting before any other factor (funding, open interest, volume) is read. A trader who reads the breadth quadrant first and the single-name candle second is asking a different question from the trader who reads the candle first and the quadrant never.
Breadth as a regime gate, not a forecast
Breadth is best used as a regime gate. The trader is not trying to predict that breadth will rise or fall over the next four hours; they are using the current breadth label to condition the conviction of single-name setups. That is a different epistemic claim from "breadth at 78 percent will mean continuation by midnight." Breadth as a gate is observational; breadth as a forecast is speculative.
A regime gate using breadth might say: "if breadth is below 30 percent, treat all single-name long setups as fade-bias and require an exceptional factor stack to even consider entry." That rule is binary, easy to operationalize, and respects the asymmetric information value of breadth. A trader using this rule will pass on more setups in low-breadth tapes than in high-breadth ones, which is exactly the desired filtering behavior.
The mirror rule applies to shorts: "if breadth is above 70 percent, treat all single-name short setups as fade-bias." A trader who shorts into rising breadth is fighting the dominant flow, and the rule keeps them from confusing a single weak chart with a market-wide weakness story that is not there. The rules are not subtle, which is the point. Breadth as a gate works because it forces the trader to be explicit about a context they would otherwise read by gut feel.
- Breadth below 30 percent: long setups fade-bias.
- Breadth above 70 percent: short setups fade-bias.
- Breadth between 40 and 60 percent: chop tape, neither side has conviction.
- Breadth changing direction fast: regime transition, suspend rule application.
How breadth interacts with BTC trend and dominance
Breadth and BTC trend usually move together but not always. The interesting regimes are the ones where they diverge. BTC up with low breadth is the "BTC alone" tape — capital is rotating into the dominant asset without altcoin participation, and altcoin longs in this tape will underperform even when the BTC move is strong. BTC down with high breadth is the "altcoin season ending" tape — altcoins are still holding up while BTC slips, but the divergence rarely lasts more than a few hours before alts capitulate.
Dominance — BTC dominance specifically — interacts with breadth as a second-order check. When BTC dominance is rising and breadth is high, altcoins are participating in a broad rally despite capital flowing into BTC; that is a genuine risk-on tape because alts can rally even against the headwind of dominance. When BTC dominance is rising and breadth is low, alts are bleeding while BTC absorbs the flow; that is the textbook setup for fading altcoin long setups.
The combined read — breadth plus BTC trend plus dominance direction — is what a robust regime label looks like. None of the three on its own is sufficient. Breadth without BTC context can mislead during BTC-led moves; BTC without breadth context can mislead during alt-led rotations; dominance without either misses the magnitude of the broader risk appetite. The three together produce a label that holds up across regimes.
What a useful breadth indicator publishes
A useful breadth indicator publishes more than a single number. The minimum useful surface is: current breadth percentage, the direction of change over the last hour, the BTC trend label for context, and a categorical regime tag (risk-on / mixed / risk-off) derived from the combination. A single number — "breadth: 47 percent" — is a thermometer reading without an interpretation, and most traders will not do the interpretation work in real time.
A better surface adds historical context. "Breadth is 47 percent, down from 62 percent six hours ago, in a BTC-flat regime" is a sentence a trader can act on. "Breadth is 47 percent" is a fact a trader will skip past. The interpretation layer is what turns the indicator from a reference value into a decision input. Indicators that do not publish the interpretation layer are leaving the work undone.
The best surface integrates breadth into the alert pipeline. Every single-name observation carries the current breadth label inline; observations in hostile-breadth conditions are either suppressed entirely or flagged with a suppression-reason note. The trader does not have to look up the breadth read separately; the regime context arrives with the alert, and the decision happens in the same surface where the observation is published.
- Current breadth percentage with the window definition explicit.
- Direction of change over the last hour or two.
- BTC trend and dominance label for cross-check context.
- Categorical regime tag (risk-on / mixed / risk-off) on every alert.
Common ways breadth is misread
The most common breadth misread is taking the instantaneous value as the whole signal. Breadth at 65 percent right now is one data point; breadth at 65 percent that was 35 percent two hours ago is a different signal from breadth at 65 percent that was 80 percent two hours ago. The first is rising into a rally; the second is rolling over from a peak. The same point estimate carries opposite interpretations depending on the trajectory.
The second common misread is window confusion. Breadth measured on a 24-hour window will smooth out moves that a 4-hour window catches in real time, and vice versa. A scanner that publishes 24-hour breadth as if it were a real-time gauge is misleading the trader during fast tapes; a scanner that publishes 4-hour breadth without saying so risks looking volatile to a trader who expected the longer window. The window definition has to be explicit.
The third common misread is treating breadth as if it predicts altcoin season. Breadth at 78 percent means many alts are currently positive; it does not mean the next month will be an altcoin bull run. Conflating the current regime label with a multi-week forecast is how traders end up holding longs through breadth deterioration because "we are in alt season." The forecast claim is a different claim from the regime read, and the data does not support the longer projection.
How SENTINEL uses breadth
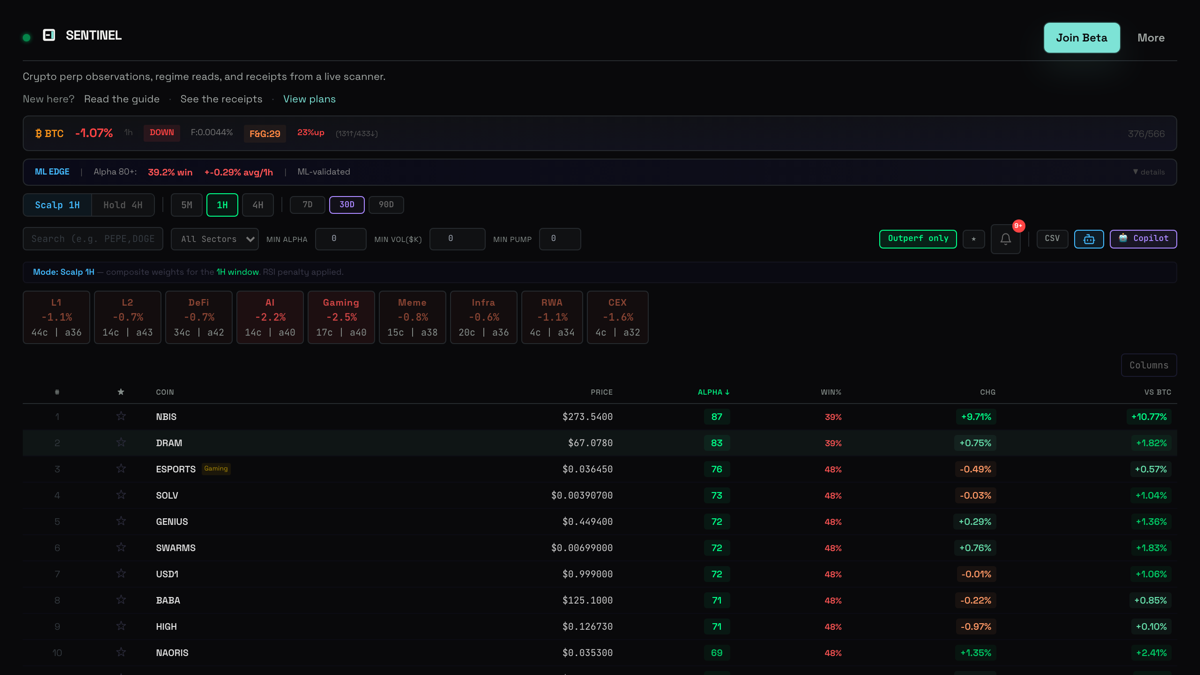
SENTINEL computes breadth as the percentage of eligible Bybit USDT-perp contracts positive over a rolling 24-hour window, evaluated against the active universe rather than a fixed top-N subset. The breadth read is paired with the BTC trend label (rolling moving-average derived) and a volatility context to produce a categorical regime tag attached to eligible CORE-tier observations. The full tag is published inline with the alert; public regime context is available on /performance.
The regime gate uses breadth as the primary suppression input. Long-bias observations in a low-breadth regime are either dropped or marked with a suppression reason. Short-bias observations in a high-breadth regime get the mirror treatment. The gate is not always right — regimes can transition mid-alert — but it prevents the largest category of false positive, which is firing the same setup across breadth regimes as if the broader tape did not matter.
The free SENTINEL Trend Pine script is hosted openly so traders can use a transparent chart-side trend reference alongside the candle chart they are already watching. That keeps the full server-side factor stack, regime gate, and internal model diagnostics in the scanner while still giving a chart-based tool away for free.
Risk boundary
Breadth is observation, not instruction. A regime tag derived from breadth reduces the probability of misreading a single-name move; it does not eliminate the risk that the regime transitions on a faster cadence than the gate, that an idiosyncratic setup extends despite hostile breadth, or that the trader misapplies the rule by reading the breadth label too literally. Breadth is a gate, not a forecast, and gates can be wrong.
Bybit perpetual futures are leveraged products. A breadth-conditioned read is a context layer over price, not a substitute for risk management. The largest single-trade winners and the worst single-trade losses both happen in tapes that look identical on the candle chart; the breadth context only narrows the read, it does not collapse it to a single answer. Read the public receipts before trusting any tool that claims to publish regime-conditioned signals — including this one — and read the risk disclosure before using the Telegram beta.
Try it live
Connect wallet first, then continue with Telegram to unlock trial/Core features.
How this was produced
Every claim was verified against the live SENTINEL codebase and the current product surfaces. This is educational product documentation, not financial advice.