Bybit Short Squeeze Detector: Reading Funding, Open Interest, and Volume Together
Most "breakouts" on Bybit perps are short squeezes in disguise. A guide to detecting the factor signature that separates a real breakout from a forced unwind, with a worked example.
Summary
A real Bybit short squeeze and a real breakout look identical on the candle chart. The factor signature underneath is opposite: a squeeze has shorts covering (open interest falling) while a breakout has new longs entering (open interest rising). Volume, funding, and the spot-perp gap finish the picture.
A trader who chases a squeeze candle is buying the top of a forced unwind. A trader who chases a breakout candle is joining a trend that still has fuel. The same +14% move can be either, and the receipt cleans up differently in the next four hours.
Why "Bybit short squeeze" is the right search query
A short squeeze is a forced unwind. Shorts who paid funding to stay short are now buying back to cover their positions, and that cover-buying lifts price faster than a normal breakout would. It is mechanically different from a breakout where new longs are committing capital and open interest is expanding.
On Bybit perps the distinction matters more than on spot because leverage compresses the time horizon. A 10% squeeze on a thinly-positioned alt can play out in 30 minutes; the same 10% breakout on a well-positioned name can build over hours. A trader who confuses the two ends up chasing entries that no longer have asymmetry.
The factor stack — funding, open interest, volume, and the spot-perp gap — is what separates the two without waiting for hindsight. None of those factors live on the candle chart, which is why a TradingView alert alone usually cannot answer the question.
The factor signature of a real short squeeze
A short squeeze on a Bybit perp has a distinctive fingerprint. The hallmark is open interest falling while price is rising. Shorts are closing positions, which removes open interest from the book; cover-buying drives the candle. New longs may also enter at the same time, but in a clean squeeze the closing-shorts dominate the open-interest delta.
Volume ratio (current 24h volume vs the trailing baseline) spikes hard during a squeeze because two-sided liquidity converges in a narrow time window: panicked shorts on one side, opportunistic momentum buyers on the other. The volume ratio alone is not diagnostic, but combined with the open interest drop it is a strong tell.
Funding flips during a squeeze. A name that was sitting at materially negative funding (paying to be short) suddenly sees funding move back toward zero or even turn positive as positioning unwinds. The funding move usually leads the open-interest drop by a few minutes; it is the earliest factor to flip.
- Open interest falls while price rises — the squeeze tell.
- Volume ratio spikes 3x to 10x trailing baseline.
- Funding rate moves from negative toward zero or positive.
- Spot price lags the perp by 1% to 3% during the move.
The factor signature of a real breakout
A real breakout has the opposite factor signature. Open interest rises with price, because new longs are entering positions rather than old shorts closing them. The trade is being put on, not unwound. Volume can be lower than a squeeze candle because there is less two-sided urgency; one side is committing, the other side is not panicking.
Funding during a breakout tends to build in the direction of the move. New longs enter, longs pay shorts via positive funding, and the funding rate ticks higher. If funding is already very positive when the breakout fires, the setup is more vulnerable to a counter-squeeze later, but the breakout itself is real.
Spot leads perp on a clean breakout. The cash market sets the structural bid, and the perp follows. If perp leads spot by a large margin during what looks like a breakout, it is more likely that perp positioning is driving the move and the breakout will not hold without spot validation.
- Open interest rises with price — the breakout tell.
- Volume ratio elevated but not necessarily extreme.
- Funding moves in the direction of the trade and stays there.
- Spot leads perp; the cash market sets the bid.
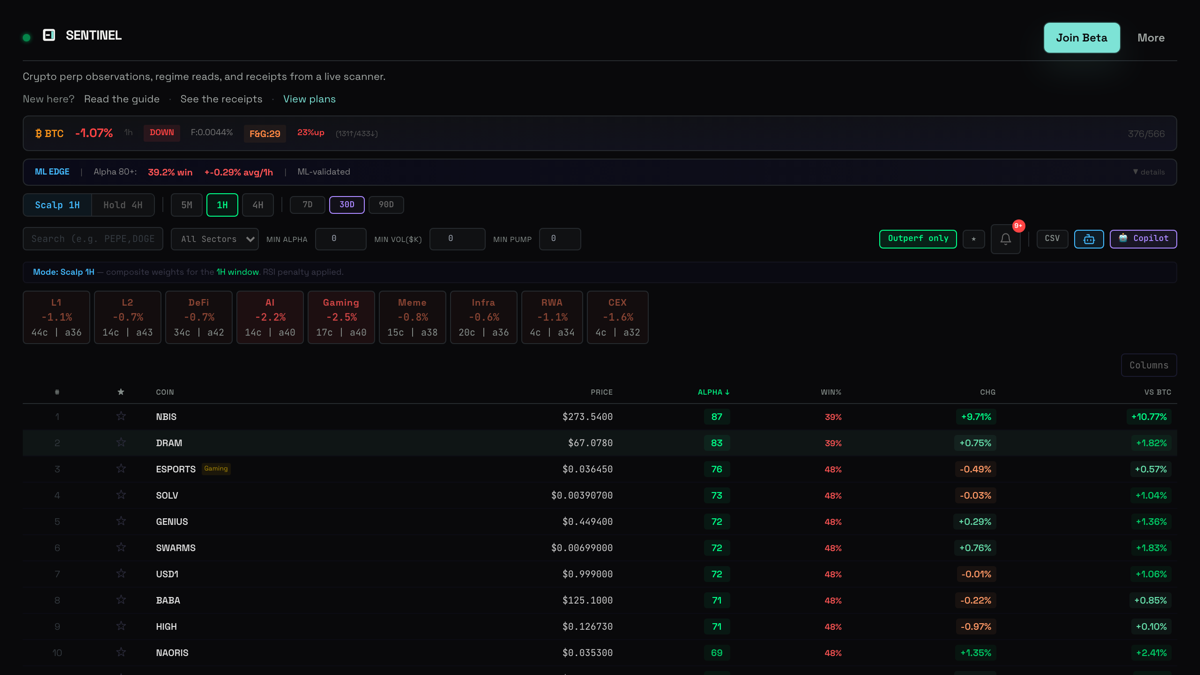
A worked example: $ESPORTS on 2026-05-26
On 2026-05-26 around 22:00 UTC, ESPORTSUSDT on Bybit perp was the top single-name mover in a heavy down-tape: BTC down 0.36%, breadth only 24% green (136 of 566 perps positive). ESPORTS itself was up 13.9% intraday. The naive read is breakout. The factor stack said otherwise.
Volume ratio on ESPORTS was 7.9x its trailing baseline — a hard spike. Open interest, however, was down 6.95% over the same window. Shorts were closing positions faster than new longs were entering. The 13.9% candle was a cover-bid, not a commitment-bid. This is the exact signature described in the previous section, observed live.
Twelve hours later, ESPORTS was up another 11% from that observation point. That follow-through is consistent with a multi-leg squeeze, where the first cover-leg drags subsequent shorts into stop runs, which trigger the next cover-leg. The lesson is not "chase the candle"; it is that early cover-flow, middle squeeze-extension, and late funding reversal are different risk states that should not be collapsed into one breakout label.
This was a dated worked example from 2026-05-26, not a claim that the row still sits in the current rolling receipt window. For the current CORE-tier track, use /performance; the same squeeze pattern can still show up on other names when funding, OI, volume, and regime align.
Why the distinction changes the trade
A squeeze and a breakout have different geometry. A squeeze often rewards the trader who already understood the positioning unwind, not the trader who reacts late to the visible candle. Once cover-buying is visible in OI deltas, much of the fast flow may already have entered. The risk of late reaction is buying the top of an unwind, where the very next prints can be either a continuation leg or a sharp mean-reversion as the squeeze finishes.
A breakout has a different structure: open interest is still building, funding is still constructive, and the candles are publishing a coherent commitment story. Pullbacks can be more orderly because new positioning provides the bid, not panicked shorts.
The factor stack converts what looks like one binary question into two separate questions: is this a squeeze, and is this a breakout. The answer changes the risk read. The candle chart cannot tell the difference. Funding, OI, and the spot-perp gap can.
- Squeeze: late reaction risk is high, position-management context matters more than the candle itself.
- Breakout: new-positioning context matters; pullbacks can behave differently from forced cover-flow.
- Hybrid: rising OI AND short-cover legs — uncommon but the strongest setup.
- Trap: candle that looks like breakout but OI is falling — fade or stand aside.
What a Bybit short squeeze detector actually does
A short squeeze detector is not a single indicator. It is a stack of cheap factor reads that together resolve the squeeze-vs-breakout question. The minimum viable stack is open interest delta, volume ratio against a rolling baseline, funding rate level and direction of change, and a spot-perp gap measure.
A good detector publishes the full factor read alongside the alert. A trader who only sees "ESPORTSUSDT up 13.9%" learns nothing they did not already know. A trader who sees "+13.9% on vol 7.9x with OI minus 6.95% and funding flipping toward zero" can decide in under 30 seconds whether to chase, fade, or pass.
The detector should also publish misses. A factor stack that calls 100 squeezes and never publishes the wrong ones is not a detector; it is a presentation. Public receipts that include the squeeze candles that failed are the only honest evaluation surface.
How SENTINEL implements this
SENTINEL scans Bybit perpetual markets server side and computes the factor stack — funding rate, open-interest delta, volume ratio, ATR, RSI, momentum scores, plus a market-wide regime label (BTC move plus breadth plus volatility) — across the full perp universe on a rolling cadence. Observations that match the squeeze configuration surface in a tier called liqsqueeze; the broader factor-stack observations route through the sweet and super tiers.
The current CORE-tier rolling track is on /performance. Eligible CORE observations are delivered to subscribers via the Telegram bot, while resolved rows remain the public evaluation surface. The hosted SENTINEL Trend Pine script is free and open-source, giving traders a transparent chart-side trend reference before they decide whether the paid Telegram stream is useful.
There is no claim that every squeeze is caught or that every alert wins. The product surface is that the factor stack is computed consistently, the observations are timestamped, and the receipts are public — including the misses. Squeeze detection is a multi-factor read, not a prediction.
Common mistakes
The most common mistake is reading OI in isolation. OI rising is not always bullish; OI falling is not always bearish. The interpretation flips based on whether price is up or down at the same time. The four-quadrant read (price up or down x OI up or down) is the minimum context.
Another common mistake is acting on funding rate alone. A name with very negative funding looks "primed for a squeeze" but funding can stay extreme for hours or days before any positioning event. The squeeze trigger is the cover flow showing up in OI deltas, not the funding level itself.
A subtler mistake is ignoring regime. A squeeze candle in a high-breadth rally is more likely to extend, because the market-wide tape supports continuation. The same candle in a thin-breadth down-tape is more likely to mean-revert quickly because there is no broader bid to support follow-through. Regime conditions the conviction, not the signal.
- OI alone is not directional. Read it with price.
- Funding alone is not a trigger. Read it with OI delta.
- Volume alone is not diagnostic. Pair it with the OI direction.
- Regime sets the floor for whether any squeeze can extend.
Risk boundary
A short squeeze detector reduces the probability of misreading a candle. It does not predict outcomes, eliminate losses, or guarantee any specific entry. Bybit perpetual futures are leveraged products. Squeeze candles often produce both the most impressive single-trade winners and the worst single-trade losses for traders who chase late.
Treat the factor stack as observation, not instruction. Read the public receipts before trusting any tool that claims to flag squeezes — including this one. SENTINEL publishes both winners and losers on the CORE-tier surface; that is the only honest way to evaluate a research signal. Read the risk disclosure before using the Telegram beta, and never let an alert system define position size or stop placement.
Try it live
Connect wallet first, then continue with Telegram to unlock trial/Core features.
How this was produced
Every claim was verified against the live SENTINEL codebase and the current product surfaces. This is educational product documentation, not financial advice.