Bybit Perp Scanner vs TradingView Screener: Two Tools, Two Jobs
A methodology-led comparison of a Bybit perp scanner and the TradingView screener: what each is built to answer, where the screener stops short on derivatives data, and why the honest dividing line is charting versus a recorded research process.
Summary
The TradingView screener and a Bybit perp scanner look like competitors, but they are built to answer different questions: one filters charts on price and indicator math, the other ranks perpetuals on derivatives microstructure and keeps a record of what it surfaced.
This is a vendor-neutral comparison of where each tool is strong, where the screener runs out of road on perp-native data, and why the real choice is between a charting filter and an auditable research process.
Two tools that look like rivals but answer different questions
On the surface, a TradingView screener and a Bybit perp scanner overlap. Both take a universe of symbols, apply filters, and hand you a shorter list. It is tempting to treat them as substitutes and pick whichever is cheaper. That framing hides the more useful question, which is what each tool was actually designed to answer.
The TradingView screener is a charting filter. Its native language is price and indicator math across an enormous universe of markets and timeframes: moving averages, relative strength readings, candle patterns, volume on the chart, and custom Pine conditions. It is exceptional at the job of compressing thousands of charts into the handful that match a technical setup you can describe.
A Bybit perp scanner is a derivatives instrument. Its native language is the microstructure of perpetual futures on one venue: funding, open interest, the relationship between price and positioning, market regime, and breadth across the perp universe. It is built to answer whether a move is clean enough to investigate or already crowded enough to leave alone. Those are different questions, and the better mental model is two jobs, not one contest.
Where the screener is strong, and where it stops
The screener is the right tool when the question is fundamentally about the chart. If you want every market above its moving average with an expanding range and rising on-chart volume, a screener will give you that across spot and derivatives, across venues, in seconds. As a top-of-funnel charting filter it is hard to beat, and a perp scanner is not trying to replace that.
The screener begins to stop short when the question becomes perp-native. Funding is not a chart indicator; it is an exchange-specific cash flow between longs and shorts that tells you who is paying to hold the move. Open interest is not derivable from candles; it is the count of contracts that have to unwind. The relationship between a price move and the open interest behind it is where a lot of the signal in perpetuals lives, and that relationship is not something a price-and-indicator screener was built to express. You can sometimes bolt a single derivatives field onto a screener, but you are reading it in isolation, divorced from the regime and breadth context that make it mean something.
Charting versus a recorded research process
There is a second difference that matters more than the data and is easy to miss. A screener is stateless by design. It shows you what matches your filter right now. When the page refreshes, the previous list is gone, and there is no built-in ledger of what the filter surfaced last week or how those candidates resolved. That is correct behavior for a charting tool, but it means the screener cannot tell you whether its own output has been any good.
A research-grade perp scanner can be built to keep that record. The output is not just a live list; it is a set of observations that resolve to a public outcome over time, wins and losses retained at equal weight, with the sample size visible. The point is not that the scanner is smarter than the screener. The point is that it is accountable to its own past in a way a stateless filter is not. You can audit it. You can disagree with the method because the method is written down. You can open the worst window instead of being shown the best one.
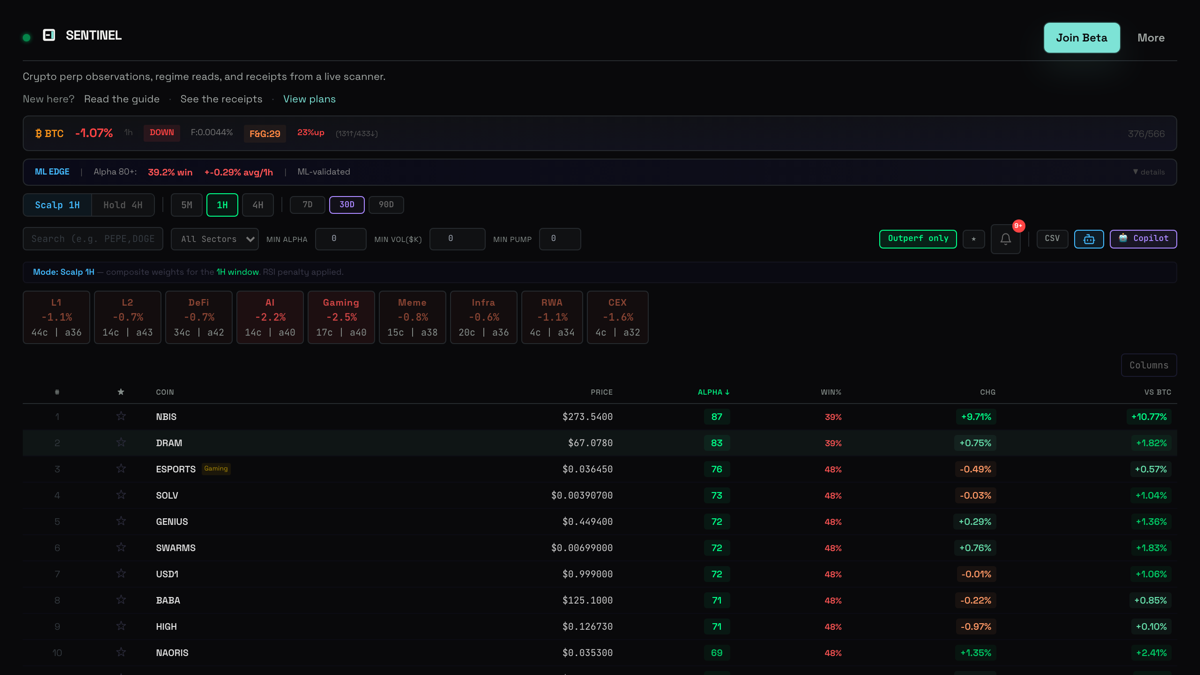
This is the dividing line we hold ourselves to. SENTINEL is a Bybit perp scanner built as a public research desk: it ranks perpetuals across price movement, momentum, volume, funding, open interest, regime, and breadth, and resolved CORE observations land on receipts you can read yourself. That includes red windows when the recent cohort is weak, because a record you can only trust when it is green is not a record at all.
How to choose, honestly
You do not have to choose only one. Many traders use a screener as the top of the funnel to compress the chart universe, then take the survivors into a perp scanner to read the derivatives context and check the recorded process before committing attention. The screener answers "which charts match my technical setup," the perp scanner answers "is this perp move clean, crowded, or already paid for, and has the desk that flagged it been honest about its outcomes."
If your decisions are driven mainly by chart structure, the screener may be all you need, and you should not pay for more. If your decisions depend on funding, open interest, and positioning on a specific venue, a price-and-indicator screener is the wrong instrument for that part of the job, and a perp scanner with a published track record is the more honest fit. None of this is financial advice, and a transparent record is not a promise of future results; it is simply the standard that lets you judge a tool by its outcomes instead of its highlight reel.
Common questions
Is a Bybit perp scanner better than the TradingView screener?
Neither is strictly better; they answer different questions. The TradingView screener is a charting filter built on price and indicator math across a huge universe. A Bybit perp scanner reads perpetual-futures microstructure on one venue — funding, open interest, positioning, regime, and breadth — and can keep a recorded outcome of what it surfaced. Use the screener for chart filtering and the perp scanner for derivatives context.
Can the TradingView screener read funding and open interest?
It can sometimes display a single derivatives field, but it was built for price and indicator conditions, not for perpetual-futures microstructure. Funding is an exchange-specific cash flow between longs and shorts, and open interest is the count of contracts that must unwind; reading them in isolation, without regime and breadth context, loses most of the signal.
Why does a recorded track record matter in this comparison?
A screener is stateless: it shows what matches your filter now and keeps no ledger of how past output resolved. A research-grade perp scanner can retain its observations as public receipts, wins and losses at equal weight with the sample size shown, so the tool is accountable to its own past instead of only its latest screen.
Do I have to choose one or the other?
No. A common workflow uses the screener as a top-of-funnel charting filter, then takes the survivors into a perp scanner to read funding, open interest, and the recorded process before committing attention.
Try it live
Connect wallet first, then continue with Telegram to unlock trial/Core features.
How this was produced
Every claim was verified against the live SENTINEL codebase and the current product surfaces. This is educational product documentation, not financial advice.