IvanOnTech’s MoneyLine Indicator: An Honest Teardown
MoneyLine is the trend indicator behind IvanOnTech’s Bullmania. Here is how it most likely works, what a trend line can and cannot do, and how to get the same thing free.
Summary
MoneyLine is the trailing trend line sold inside IvanOnTech’s Bullmania (formerly Moralis Money). Its entire observable behaviour, one line that turns green in an uptrend and red in a downtrend with exactly two flip alerts, is the signature of a SuperTrend: a public, free, ATR-based indicator.
The honest part most vendors skip: a bare trend flip is the easy 20% of the problem. We run the same kind of engine, and when we tested a bare flip out-of-sample it lost money. The work that matters is everything you wrap around the line, and that is what we publish.
What the MoneyLine actually is
MoneyLine is a trend indicator distributed through Bullmania, the membership IvanOnTech (Ivan Liljeqvist) relaunched in 2025 as the successor to Moralis Money. You do not download it. Your TradingView username is added to an invite-only script, and the indicator appears on your charts for as long as your subscription is active. The marketing is refreshingly simple about what it shows: a single line where, in the words of the product page, green means buy and red means sell, with the advice to get in when the trend flips bullish, ride the move, and step aside when it turns bearish.
The observable surface is small and worth listing precisely, because the details are the whole story. It is one line on price. It exposes two alerts, one for the flip from downtrend to uptrend and one for the reverse. A companion scanner reduces every asset to a single binary state, bullish or bearish, plus a "time since it flipped" counter. On the weekly timeframe the marketing notes it only makes a handful of trades per year. We checked the public Bullmania pages again during this July 2026 refresh; the crawlable public copy describes MoneyLine, Money Scanner, community, sessions, and education access, but does not expose a stable plan price. In its Moralis Money incarnation, the comparable plan was reported at roughly 97 dollars per month.
None of that is a criticism yet. It is a clean, well-packaged product. But that short list of outputs tells you almost exactly what the math underneath has to be.
The tell: what its outputs reveal about the math
An indicator is constrained by the things it can say. MoneyLine says exactly two things: the trend flipped up, or the trend flipped down. Its scanner says one thing: which side of the trend an asset is on, and how long it has been there. That output signature is not generic. It is the complete, characteristic fingerprint of a single-state trailing trend filter.
Work through the alternatives and they fall away. An oscillator (RSI, MACD, a money-flow index) would expose overbought and oversold levels, divergences, or zero-line crosses, and it would live in a sub-pane, not as one line on price. A moving-average system would expose multiple lines and cross events. A band or cloud system would expose envelopes and squeezes. MoneyLine exposes none of these. One line, two flip events, a binary state. That narrows the field to the trailing-stop family, and within it, overwhelmingly, to one well-known member.
- One line on price, recoloured by direction: a single-state trend filter, not an oscillator.
- Exactly two events worth an alert (flip up, flip down): a state machine with two states.
- A scanner that outputs binary trend plus time-since-flip: the natural readout of a trailing stop.
So it is, almost certainly, a SuperTrend
A SuperTrend is the canonical single-line trailing trend filter. It draws a band a fixed multiple of Average True Range away from price, lets that band ratchet only in the trend’s direction, and flips when price closes through it. The result is exactly what MoneyLine shows: a line that sits below price and reads green in an uptrend, jumps above price and reads red in a downtrend, and changes state on a close. Independent traders who have rebuilt MoneyLine-style tools on TradingView converged on the same recipe, an ATR trailing stop, sometimes with Heikin-Ashi smoothing and a momentum filter layered on to calm the whipsaws. Some Bullmania users have gone further and claimed in public reviews that it is simply TradingView’s free SuperTrend run at non-default settings. We cannot confirm the exact parameters, because the source is private, and we are not going to assert numbers we cannot see.
What we can say with high confidence is the family. We have spent real time on this class of indicator, and every honest reconstruction of MoneyLine’s behaviour lands on an ATR-based trailing stop. It is worth being clear about one thing here, because it gets muddled in marketing: ATR itself is not a trend indicator. ATR is a pure volatility measure, the average size of a bar’s range. It has no direction. A SuperTrend is the directional machine built on top of it. So "is MoneyLine different from a SuperTrend or an ATR" has a clean answer. It is not really different from a SuperTrend, and ATR is just the volatility engine inside that SuperTrend. There is no third mystery ingredient that the two-alert, one-line surface leaves room for.
What a SuperTrend is, in plain terms
You do not need code to understand it. Take the midpoint of each bar. Measure recent volatility with ATR. Draw a lower band one ATR-multiple below the midpoint and an upper band one ATR-multiple above. In an uptrend you follow the lower band, and it only ever ratchets upward, never loosens, until price closes below it, at which point the trend flips and you follow the upper band down. That ratchet-and-flip is the entire mechanism. The two knobs are the ATR length and the multiplier. A bigger multiplier sits the line further from price, so it flips less often and lags more at turns. A smaller one hugs price and whipsaws more. That trade, fewer flips for more lag, is the only dial that exists, and no amount of branding removes it.
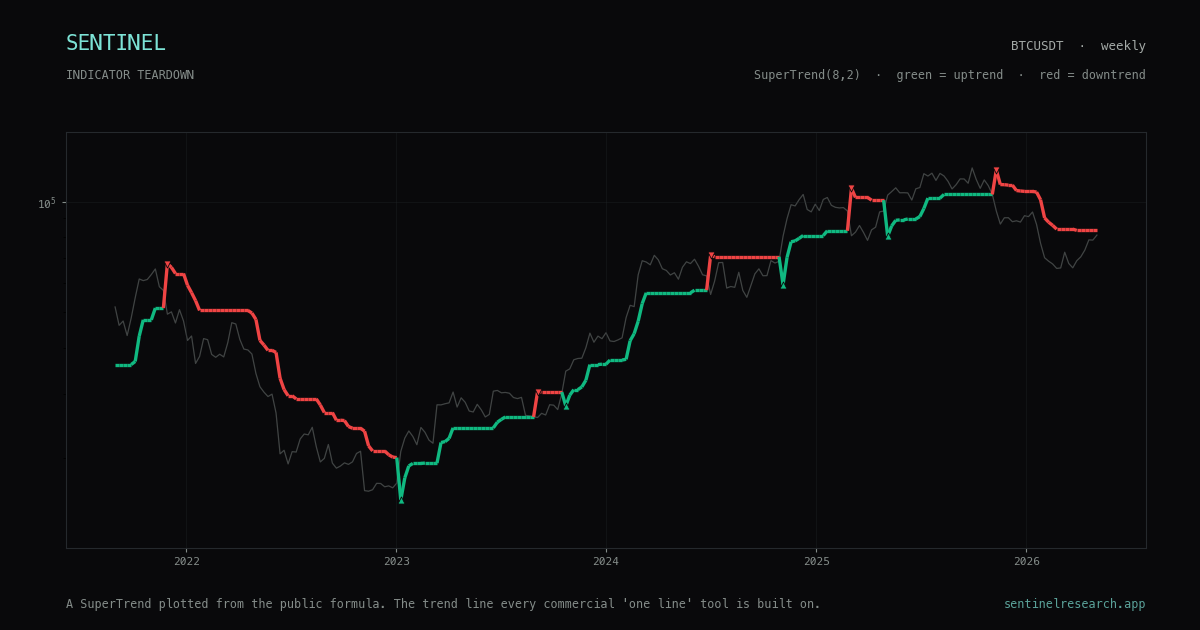
The chart at the top of this page is a SuperTrend plotted from that public formula on Bitcoin’s weekly candles, from 2021 to 2026. We generated it from cached price data, not from any paid tool. Notice how few times it flipped: nine trend changes across roughly five years, a little under two a year. That is the same "handful of trades per year" the weekly marketing describes, because it is the same kind of object. As a second check, we ran two quite different SuperTrend settings over the same Bitcoin history and they agreed on the direction of the trend about three-quarters of the time, 74 percent of the bars. The precise parameters move the flip count around, but they do not change what the tool fundamentally is. The magic, such as it is, is not hiding in the settings.
We run one too, and here is what testing it taught us
This is where our view stops being about Bullmania and starts being about the honest limits of the whole category, because we did not just read about this indicator. We run one. SENTINEL operates a SuperTrend as a research surface: a weekly trend-state engine, period 14, multiplier 1.0, computed only on confirmed closes so it never repaints history. It is shadow-only and still soaking through a 12-week validation gate. We are not selling it to anyone.
When we tested whether the bare flip actually makes money out-of-sample, the answer was no. A plain weekly SuperTrend, traded on its own with no other condition, came out with an out-of-sample profit factor near 0.35. That is a losing configuration, not an edge. Pure trend-flip controls failed across every timeframe we checked. The only thing that recovered a positive result was gating the trend, taking the long only when the broader market was also trending up and price was not already overextended, and sizing for the risk. Gated that way, the reconstructed profit factor landed around 2.0 to 2.5, and we label that exactly: reconstructed from historical data, not a live track record, with bear-market behaviour still untested. We even tried the obvious next step, bolting a trend filter onto our live tiers as an overlay, and it did not survive a cluster bootstrap. The confidence interval spanned zero, so we did not ship it, and we wrote that negative result down on our research page rather than burying it.
We mention an earlier, eye-catching figure above 4 that this engine once appeared to produce, only to be transparent that we corrected it downward ourselves once we accounted for duplicate instruments, clustered trades, survivorship, and fees. That is the difference we are trying to draw. The point is not that a trend line is worthless. The point is that the line is the easy part, and the work that turns it into something tradeable is the part nobody puts on a sales page.
What a trend line can and cannot do for you
Trend-following is a real thing, not snake oil. There is genuine academic support for trend strategies in crypto, and a disciplined trend line does two useful jobs: it keeps you on the right side of long sustained moves, and it gets you out before the worst of a drawdown, which is worth more to most traders than any single entry. If MoneyLine helps someone stop fighting an obvious downtrend, that is a real benefit, and we are not going to pretend otherwise.
What a trend line cannot do is manufacture an edge by itself, and the marketing tends to blur that line. A backtest shown only on Bitcoin, Ethereum, Solana, and a couple of other survivors is flattered by survivorship: those are the coins that did not die, and a weekly trend follower over a window that contains a bull leg beats buy-and-hold on drawdown almost automatically. None of that tells you how the same tool behaves in chop, in a bear, or on the long tail of alts that quietly went to zero. The honest framing is below.
- It does well: riding long trends, cutting catastrophic drawdowns, imposing discipline on exits.
- It does badly: ranging and choppy markets, where it flips repeatedly and bleeds on each reversal.
- It always lags: by construction it confirms a turn after price has already moved a band-width.
- Its demo flatters it: weekly, on survivor coins, in a window with a bull leg, is the easy case.
Is MoneyLine worth paying for?
Our verdict is measured, not a takedown. This is not a scam. Ivan Liljeqvist is a real, long-tenured figure with a real company behind him, and when Moralis Money was wound down into Bullmania, subscriptions were pro-rated and refunded, which is not how a fraud behaves. If you value the community, the daily presence, the scanner, and the structure of a paid room, those are legitimate things to buy, and some people genuinely want them.
What we would push back on is paying a monthly subscription for the indicator itself, because the indicator is a trend line, and a competent trend line is free. You can add a SuperTrend to any TradingView chart in ten seconds at no cost. The thing you would actually be paying for is the packaging and the room around it, not a proprietary edge, and it is worth being clear-eyed about which of those you are buying. A clean line sold with a survivor-coin weekly backtest is not differentiated alpha, and a thirty-second free indicator does the same drawing.
How to get the same thing free, and what to add
If the MoneyLine concept appeals to you, you can reproduce it in a few minutes and keep your subscription money. The first steps are trivial. The step that actually matters, the gating, is the one the paid version does not teach, and it is the only step that moved the result in our own testing.
We also built our own free, non-repainting trend line, SENTINEL Trend, in the same spirit: it is openly a SuperTrend, it says so in its own description, and the source is published under MPL 2.0 so users can inspect it, fork it, and improve it. Use whichever you like. The tool is not the point. What you wrap around it is.
What we do differently
The reason we can write this teardown without flinching is that we hold ourselves to the same standard we are applying to MoneyLine. We give the trend line away. We publish the methodology, the validation gates, and the experiments that failed, including the trend overlay that did not survive its confidence interval. And we run a live receipts page that updates whether the result is good or bad, including weak windows instead of hiding them.
That is the whole pitch, and it is deliberately unglamorous. A trend line will not make you rich, and anyone selling you one as if it will is selling the easy part. If you want the honest version, the line plus the gating plus a record that is allowed to look bad, that is what the research desk is. Info only. Not financial advice.
Common questions
Is the MoneyLine indicator a scam?
No. The operator is a real, long-tenured figure with a real company, and the move from Moralis Money to Bullmania pro-rated and refunded subscriptions, which is not how a fraud behaves. Our criticism is narrower: it is a trend line sold as if it were proprietary alpha, when a competent trend line is free.
Is MoneyLine just a SuperTrend?
Almost certainly yes, or a very close cousin. Its entire observable behaviour, one line that recolours by direction with exactly two flip alerts and a binary scanner, is the signature of an ATR-based trailing stop, which is what a SuperTrend is. We cannot confirm the exact parameters because the source is private, but the indicator family is not in serious doubt.
How much does Bullmania or the MoneyLine indicator cost?
As of this July 2026 refresh, the public Bullmania pages we could inspect described MoneyLine and Money Scanner access but did not expose a stable plan price. In its prior incarnation as Moralis Money, the comparable plan was reported at roughly 97 dollars per month. Either way, the indicator inside it is a trend line you can replicate at no cost.
Can I get a trend line like MoneyLine for free?
Yes. SuperTrend is a free built-in indicator on TradingView, and adding it takes seconds. We also publish our own free, non-repainting SENTINEL Trend line. The hard part is never the line; it is the gating and risk management you put around it.
Does a SuperTrend actually make money?
Not on its own. When we tested a bare weekly SuperTrend flip out-of-sample it produced a profit factor near 0.35, a losing result. What recovered a positive, reconstructed result was gating the trend with a higher-timeframe filter and a not-overextended check, not the flip by itself. Bear-market behaviour remains untested.
Try it live
Connect wallet first, then continue with Telegram to unlock trial/Core features.
How this was produced
Every claim was verified against the live SENTINEL codebase and the current product surfaces. This is educational product documentation, not financial advice.